
VERIZON Studio Analytics
BlueJeans Studio by Verizon is a robust video conferencing platform that is designed to intuitively host large virtual events. The analytics feature gives presenters and moderators a way to view real-time data during their event and review data from previous events. This cutting edge way of visualizing data demonstrate Figma's powerful prototyping capabilities.
Problem: Users need a way to visualize their audience's engagement data during, and after, their live stream event.
Goal: Create a feature that gives presenters and moderators a way to view real-time data during their event and review data from previous events.
Project Duration
10.01 - 01.01
~ 3 months
Product
BlueJeans Studio;
by Verizon
Team Members
Luc Gensler
Anthony Delserro
Dillon Hickey
My Role
Research, Wireframes, Mockups, Prototypes, Present to Stakeholders
Software
Figma
Jira


01
Understand The User
The first step in the design process is to understand the user. For this project, that meant conducting a competitive analysis to explore what other products in the live streaming market offered in terms of live and post-event analytics. Next, we created user flows and journeys to empathize with the user's experience and ensure the flows were intuitive and easy to navigate.

Competitive Analysis
To conduct competitive analysis I began by identifying key competitors in the live streaming and event space. I then gathered data on their analytics features, focusing on aspects such as real-time data reporting and interface design. This involved reviewing competitor documentation, analyzing user feedback, and testing the features where possible. I compared these findings against BlueJeans Studio's existing capabilities and outlined areas for improvement. This analysis provided a comprehensive understanding of industry standards and helped identify opportunities to enhance our feature set for a better user experience.
Here is a link to the competitive analysis assets:

User Journey Flow
The next step was to create journey flows to illustrate how users interact with these features. From launching the event and monitoring live metrics to accessing and sharing data after the event concludes, these items helped ensure a seamless transition from live data to comprehensive post-event insights. I identified key touchpoints, including real-time engagement tracking, data visualization, and post-event analysis. The process included sketching user interactions, defining critical steps, and incorporating feedback to refine and optimize the overall experience.
Here is a link to the user journey flow:

02
Starting the Design
After gaining insights into user needs through competitive analysis and developing initial user journey flows, I began the design process. This involved creating low-fidelity wireframes and prototypes to explore early concepts. I then shared these ideas with internal stakeholders to gather crucial feedback, which enabled me to refine and enhance the designs for the next iteration.
Paper Wireframes
One of the initial stages of the design process is creating paper wireframes, which build on the user journey and begin to bring the design to life. Using paper wireframes allows for quick ideation and iteration on early design concepts. These wireframes illustrate how users can view live engagement data during their stream, access a sharable data summary in a pop-up window, and ultimately navigate to a comprehensive analytics dashboard.


Digital Wireframes
The next stage of the design process was creating digital wireframes, transitioning the concept into the digital realm while maintaining a low-fidelity look and feel. This approach encourages open-ended discussions about how the design might appear in the system, allowing for easy iteration and ideation based on feedback from product owners, development teams, and other internal stakeholders.
Low-Fidelity Prototype
Linking digital wireframes to create a low-fidelity prototype is an effective way to present initial concepts to stakeholders. It allows design, development, and product teams to review how users will navigate the new feature. Creating low-fidelity prototypes helps us uncover details about the user journey and discuss user interactions. Reviewing these prototypes with stakeholders at this stage ensures that informed decisions are made before moving on to higher-fidelity designs.


03
Refining the Design
After reviewing the wireframes and low-fidelity prototypes, the next step is to refine the designs. This process involves incorporating feedback from internal reviews to create mockups, which are then used to develop a high-fidelity prototype.
Mockups
To further refine these designs, I started creating mockups to bring the wireframes to life. This involved integrating colors, patterns, and imagery to give the design a more realistic look and feel. I adhered to the product's design system and utilized designated company assets to ensure the designs were both aesthetically pleasing and internally consistent.

Low fidelity wireframes

High fidelity mockups
Prototype
After creating a series of mockups to cover various variables and use cases, I linked the screens together to build a robust prototype for demonstrating the new feature to our design, product, and development teams. This approach provided a realistic view of the product's look and feel. For this particular feature, I took advantage of Figma's advanced prototyping capabilities to simulate detailed data scrubbing and sophisticated data visualization filtering options.

04
Design/Development Handoff
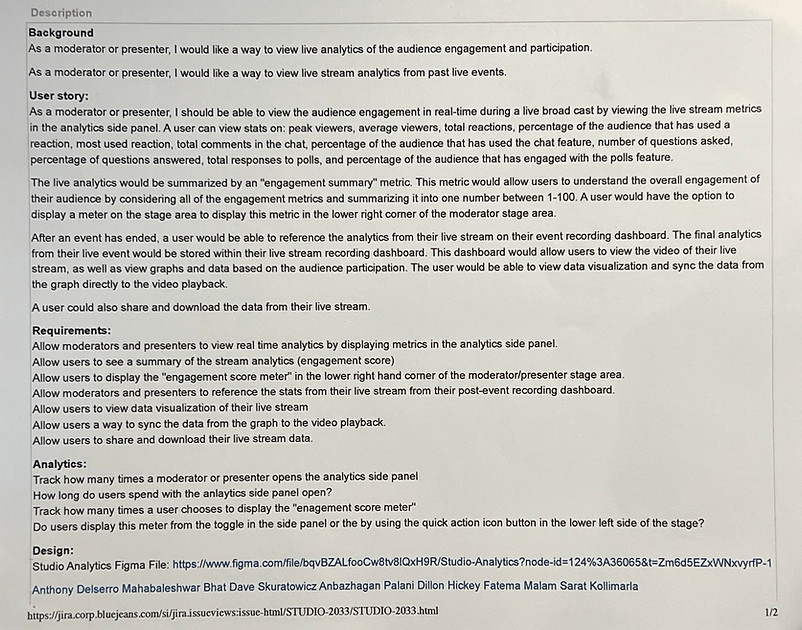
Once the designs, mockups, and prototypes were reviewed and approved by internal stakeholders, I handed them off to our development team. For this project, I used Atlassian's JIRA to create design documentation that integrated with the agile development process. I documented the initial request and requirements, and included links and videos to demonstrate the feature to the development team.


05
Going Forward
After handing off the design documentation to the development team, I continued to support the feature by answering questions and conducting design quality analysis (DQA) to ensure the product matched the designs. This helped maintain consistency throughout the design and development handoff.

What I learned
Designing a live streaming analytics platform for Verizon's BlueJeans Studio provided me with valuable insights into the end-to-end design process. I learned to conduct thorough competitive analysis to benchmark industry standards and identify unique opportunities. Creating user journey flows helped me understand and map the user experience, while developing wireframes, mockups, and prototypes in Figma refined my skills in visual and interactive design. Presenting my work to product, design, and development teams underscored the importance of iterative feedback and collaboration in refining and enhancing design solutions. This experience highlighted the need to balance user needs with technical feasibility and business goals.